Current position of the market


SPX: Very Long-term trend –
The very-long-term cycles are down and, if they make their lows when
expected (after this bull market is over) there will be another steep
and prolonged decline into late 2014. It is probable, however, that the
severe correction of 2007-2009 will have curtailed the full downward
pressure potential of the 120-yr cycle.
SPX: Intermediate trend –
SPX made a top at 1474 and is engaged in an A-B-C intermediate
correction. It is possible that wave “B” was completed at 1448.
Market Overview
It
is obvious that the near-term direction of the market has been
influenced by negotiations to resolve the “fiscal cliff” situation.
Optimism about an early solution has kept the trend bullish until
Thursday, when the mood of the house republicans dashed hopes for an
immediate resolution and caused the market to drop sharply at the
opening. Although it did recover some of its losses by the close,
enough technical damage was done to bring the indices very close to a
sell signal.
With
Monday being a shortened session, we may have to wait until Wednesday
to see if we can drive the proverbial final nail in the coffin of the
“B” wave. When the “C” wave of the intermediate correction starts in
earnest, we can expect something similar to the “A” wave from 1474 and,
if the time span of the “C” wave is equal to that of “A”, it could
last until mid-February before it is complete.
Of
course, we have to consider the possibility that 1474 was the top of
the bull market and that we are now on the verge of a new bear market.
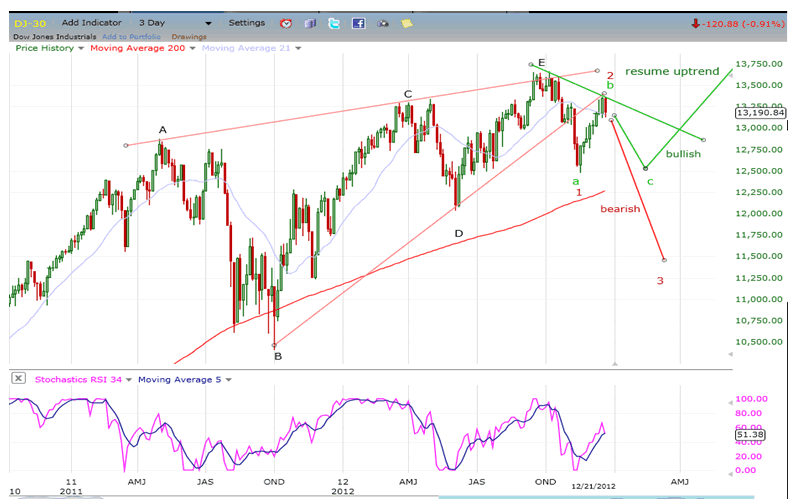
Some EW technicians see the pattern described by the DOW since April
2011 as a large diagonal triangle which would characteristically put an
end to the bull market that started in 2009. Whether or not this is
the case is something we do not have to be concerned about just now.
We already agree with the bear view that a significant decline is
coming, early next year. What happens after that is something that we
will have to assess at the proper time. Our present analytical
efforts should be to determine whether the “B” wave (or “2”) already
ended on Thursday of last week, or if it has a little more to run.
Attempts
at establishing a price projection for the SPX has produced two
possibilities: 1443 and, if there should be a final surge, 1464. The
index price has been hovering around 1443; first with a reversal from
the 1439 level, and another, Tuesday, from 1448. Technical
considerations suggest that the rally is in its last stages and looking
for a final high. Perhaps it was already met on Tuesday, but we’ll
need confirmation. There is a good possibility that next week will
give it to us.
Chart Analysis
This weekly chart of the Dow shows the two possible scenarios that lie ahead for the market. In the bearish case (which is not favored)
we would be ending wave 2 and be about to start wave 3. That wave
would most likely be a period of intense weakness probably taking the
index to the level of “B” before it ends. Needless to say, it would be
devastating to investors, re-sending their 401Ks right back into the
tank. But that would only be the beginning of a vicious bear market
which, according to cycles, should continue until the low of the 120-yr
cycle around October 2014.

The
bullish view would be far less harsh. The intermediate decline would
conclude early next year, and the bull market would go on to make a
new high, peaking perhaps around May 2013. It would then start a bear
market into October 2014 which would be bad enough, but not nearly as
severe as the first scenario. This is the option which I favor.
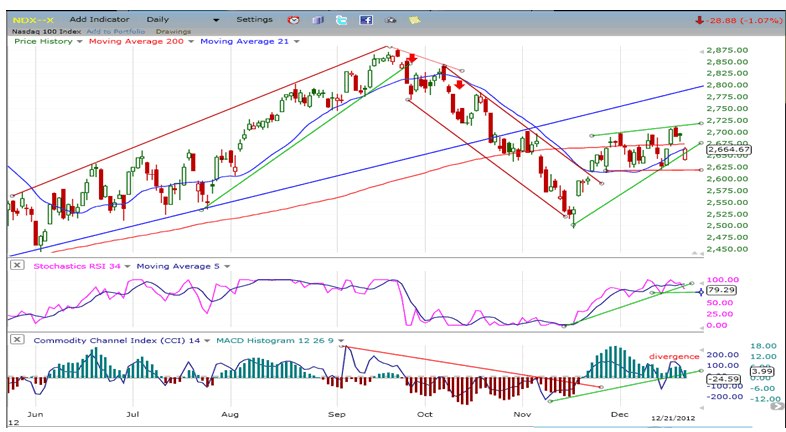
One
of the weakest indices is the NDX. It has retraced less of its decline
from the September high than the SPX or Dow, and is the one most ready
to sell off whenever there is a pull-back in the uptrend. Friday was
a good example of this tendency. Although (like the overall market) it
had regained a good portion of the day’s loss by the close, it
remained below both moving averages -- the only one of the three to do
so. Since NDX normally leads the market, its relative weakness is an
indication that we are in a correction phase and have not started
another uptrend. Also, the pattern that it is making is a small
diagonal wave which was probably completed on Wednesday. A signal that
the “C” wave is on its way will be confirmed when it closes below the
red horizontal line.
The
indicators are also showing some weakness, especially the histogram
which exhibits a strong pattern of negative divergence to the price.
The RSIS is overbought, has already turned down for the second time,
and its lines have already made a bearish cross. It does not look like
a confirmed sell signal is very far away.

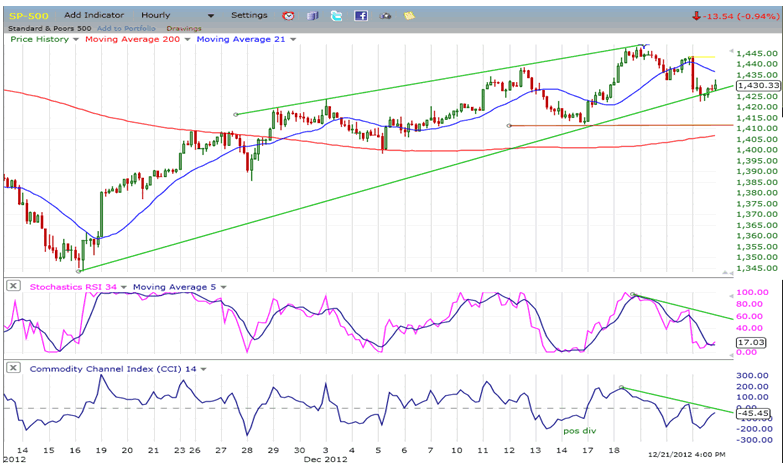
The
SPX, which has been buoyed by strength in financial stocks, is the
strongest of the three indices shown, but its hourly chart (below)
shows that the pattern it is making is also a bearish wedge which may
have been completed at 1448. If so, there is a good chance that on
Monday, there will be

another
near-term decline before we have a bounce. The price formation made
during Friday’s recovery looks like a small bear flag on the hourly
chart. If it is, the index risks dropping to about 1412-13 – the
length of the flag mast. Coincidentally, this is also a near-term
phase projection for this index according to the level of distribution
above.
The indicators have rallied along with the price on Friday, but not enough to give an hourly buy signal by the close.
Cycles
For
a while, we have been looking for the declining 66-week cycle to
reassert itself and lead the market lower into early 2013. It is
overdue!
Read More
Read More