Stock Market Fireworks Early 2013
3 Down 2 More to Go! - I have been following a number of markets since late September, and I have been looking for new highs and price to exceed those highs made on September 2012. Early this week 2 of those markets took out and surpassed the prior September highs, the NYSE and XLF making those new highs confirmed my original thoughts that the decline from the September high was a clear 3 wave decline, which I have maintained only to the cries of the bears telling me it is the start of some gigantic market crash.
Well the DAX made a new yearly high as did other European markets earlier in the month, now we have the XLF and the NYSE making new highs above the September 2012 high. So the bears that were counting those markets as topped in September have got that completely wrong, which does not surprise me at all considering they are not respecting what price is suggesting.
Why did they get it wrong? Well its simple, it was a 3 wave decline, NOT a 5 wave decline as some Elliotticians tried to count it.
Why is this important?
Well a 3 wave decline in an uptrend is a corrective pullback and should see new highs as we have seen this week on the NYSE and XLF, I have been a working a theme with many markets and patterns and it seems we are only pieces away from a full set. The DOW and the SPX have yet to exceed their respective September highs, so whilst the market is not showing signs of a strong reversal, I am going to continue to give the benefit to the bulls, to run the market higher and take out the buy stops that will be sitting at those highs. Not only would it complete some ideas I am working with, but it will also likely turn the majority of traders and the media bullish at precisely the wrong time.
Just the way I like it. Trader’s getting mega bullish at the highs, like they were at the highs in 2010, 2011 & 2012
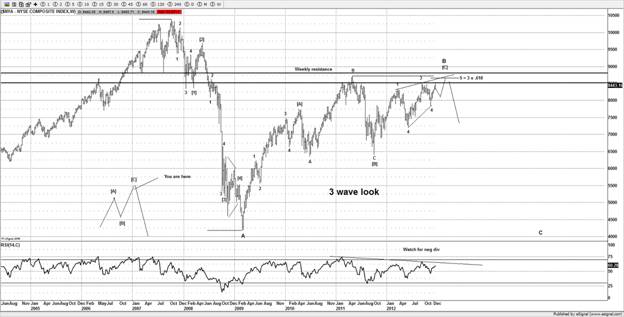
NYSE
This market can stretch a bit higher, which would help my ideas of seeing the DOW and SPX see that new price high above the September 2012 high, which would complete their ideas. It’s only just touching the target zone, so a bit more inside would setup up nicely as there is also a strong area of resistance just above that should pose as significant resistance, around 8665-8800.
Non Elliotticians can see the basic bearish wedge shape and the lack of strength to make a new high with a new price highs suggests that the market is in a topping phase, and if my main wave count is correct as shown we are setting up for a large move lower soon, although I still ideally want to see the DOW and SPX exceed their respective September 2012 high first.
Target is a test of the March 2009 lows round 4000.
XLF
From the March 2009 lows you can clearly see a similar pattern to the NYSE and a 3 wave move, furthermore the last few months we appear to be making an ending diagonal for wave [C] of a larger B wave. (large bearish looking wedge)
With the new high made this week, that ticked this market as technically completed, although if the other main markets run a bit higher and I get to see the SPX around 1480SPX I suspect this could run a little bit higher towards the strong resistance area around the blue line at $17.17.
With the large RSI divergence showing, I still favor this as being inside an ending diagonal, so once the markets are ready and setup, I favor a strong reversal potentially sometime early in 2013.
Read More
3 Down 2 More to Go! - I have been following a number of markets since late September, and I have been looking for new highs and price to exceed those highs made on September 2012. Early this week 2 of those markets took out and surpassed the prior September highs, the NYSE and XLF making those new highs confirmed my original thoughts that the decline from the September high was a clear 3 wave decline, which I have maintained only to the cries of the bears telling me it is the start of some gigantic market crash.
Well the DAX made a new yearly high as did other European markets earlier in the month, now we have the XLF and the NYSE making new highs above the September 2012 high. So the bears that were counting those markets as topped in September have got that completely wrong, which does not surprise me at all considering they are not respecting what price is suggesting.
Why did they get it wrong? Well its simple, it was a 3 wave decline, NOT a 5 wave decline as some Elliotticians tried to count it.
Why is this important?
Well a 3 wave decline in an uptrend is a corrective pullback and should see new highs as we have seen this week on the NYSE and XLF, I have been a working a theme with many markets and patterns and it seems we are only pieces away from a full set. The DOW and the SPX have yet to exceed their respective September highs, so whilst the market is not showing signs of a strong reversal, I am going to continue to give the benefit to the bulls, to run the market higher and take out the buy stops that will be sitting at those highs. Not only would it complete some ideas I am working with, but it will also likely turn the majority of traders and the media bullish at precisely the wrong time.
Just the way I like it. Trader’s getting mega bullish at the highs, like they were at the highs in 2010, 2011 & 2012
NYSE
This market can stretch a bit higher, which would help my ideas of seeing the DOW and SPX see that new price high above the September 2012 high, which would complete their ideas. It’s only just touching the target zone, so a bit more inside would setup up nicely as there is also a strong area of resistance just above that should pose as significant resistance, around 8665-8800.
Non Elliotticians can see the basic bearish wedge shape and the lack of strength to make a new high with a new price highs suggests that the market is in a topping phase, and if my main wave count is correct as shown we are setting up for a large move lower soon, although I still ideally want to see the DOW and SPX exceed their respective September 2012 high first.
Target is a test of the March 2009 lows round 4000.
XLF
From the March 2009 lows you can clearly see a similar pattern to the NYSE and a 3 wave move, furthermore the last few months we appear to be making an ending diagonal for wave [C] of a larger B wave. (large bearish looking wedge)
With the new high made this week, that ticked this market as technically completed, although if the other main markets run a bit higher and I get to see the SPX around 1480SPX I suspect this could run a little bit higher towards the strong resistance area around the blue line at $17.17.
With the large RSI divergence showing, I still favor this as being inside an ending diagonal, so once the markets are ready and setup, I favor a strong reversal potentially sometime early in 2013.
Read More