Written by Steven Hansen

This past week Industrial Production (analysis here) finally exceeded the July peaks, and now all of the economic broad measures are at 2012 highs. On 07 December 2012, Economic Cycle Research Institute (ECRI), a New York-based independent forecasting group stated:
Following our September 2011 recession call, we clarified its likely timing in December 2011. Based on the historical lead times of ECRI’s leading indexes, we concluded that, if it didn’t start in the first quarter of 2012, it was very likely to begin by mid-year.It is now 2013, and in a week and a half we will see the advance estimate of 4Q2012 GDP. It looks extremely unlikely this GDP estimate will show the economy contracted.
But we also made it clear at the time that you wouldn’t know whether or not we were wrong until the end of 2012. And so it’s interesting to note the rush to judgment by a number of analysts, already asserting that we were wrong.
ECRI specifically pointed to the weakness in the measures of production, income, employment and sales in their 07 December 2012 post:
So, with about a month to go before year-end, what do the hard data tell us about where we are in the business cycle? Reviewing the indicators used to officially decide U.S. recession dates, it looks like the recession began around July 2012. This is because, in retrospect, three of those four coincident indicators – the broad measures of production, income, employment and sales – saw their high points in July (vertical red line in chart), with only employment still rising.
 The current state of the coincident indicators is shown on the graph below.
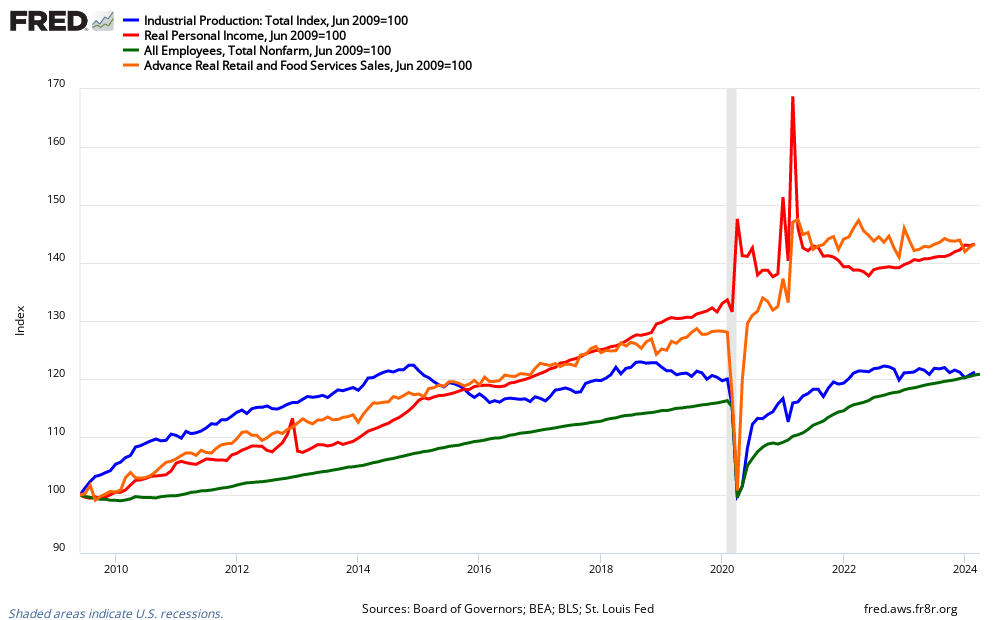
At this point their own Weekly Leading Index (WLI) which is advertised to have a six month forward vision went positive in August 2012 – the logical conclusion is that by February 2013, the chance of a recession is gone. The current WLI levels are far from territory associated with past recessions.
What ECRI is hanging on to is hope that backward revision of the data will prove them correct that a recession did indeed occur. The primary markers used to date a recession are revised YEARS after the first data is published. The best example is GDP itself. The advance 4Q2012 GDP estimate will be published at the end of the month. The advance estimate historically seems nothing more than a wild guess looking at the historical correlation to the current GDP figures published by the BEA.

Here is how NBER dates a recession:
The problem is GDP data is never set in concrete (and neither is the sector data for production, income, employment and sales). Notice in the above graph, the 2001 recession was likely not a recession as GDP never went negative. Once the NBER makes a decision on dating a recession – it is a god-like decree set in concrete.We view real GDP as the single best measure of aggregate economic activity. In determining whether a recession has occurred and in identifying the approximate dates of the peak and the trough, we therefore place considerable weight on the estimates of real GDP issued by the Bureau of Economic Analysis (BEA) of the U.S. Department of Commerce.
Whether there was or was not a recession in 2012 is no longer the point. The point now is 2013 (using forecasting data from ECRI and many other sources) looks recession free at this point. Maybe it is time for ECRI to say publicly the future seems marginally brighter for our weak economy – and possibly toss in a mea culpa on the recession call.
Other Economic News this Week:
The Econintersect economic forecast for January 2012 shows weak growth. The underlying dynamics have a whiff of improvement – as underlying trends seemed to have stabilized with some marginally improving. Most of the recession markers have evaporated, and one of our alternate methods to validate our forecast remains recessionary (but now only slightly so). All in all, still not a great forecast – but at least there is hope that conditions will be improving in the months to come.
ECRI believes the recession began in July 2012. ECRI first stated in September 2011 a recession was coming . The size and depth is unknown. The ECRI WLI growth index value has been weakly in positive territory for over three months. The index is indicating the economy six month from today will be slightly better than it is today.
Current ECRI WLI Growth Index

/images/z weekly_indexes.PNG
Initial unemployment claims fell from 371,000 (reported last week)
to 335,000 this week. Historically, claims exceeding 400,000 per week
usually occur when employment gains are less than the workforce growth,
resulting in an increasing unemployment rate (background here and here).The real gauge – the 4 week moving average – fell marginally from 365,750 (reported last week) to 359,250. Because of the noise (week-to-week movements from abnormal events AND the backward revisions to previous weeks releases), the 4-week average remains the reliable gauge.
Weekly Initial Unemployment Claims – 4 Week Average – Seasonally Adjusted – 2010 (blue line), 2011 (red line), 2012 (green line)

/images/z unemployment.PNG
Bankruptcies this Week: Penson Worldwide, Blue Earth Solutions, Direct Markets HoldingsData released this week which contained economically intuitive components (forward looking) were:
- Rail movements (where the economic intuitive components indicate a moderately expanding economy).
All other data released this week either
does not have enough historical correlation to the economy to be
considered intuitive, or is simply a coincident indicator to the
economy.